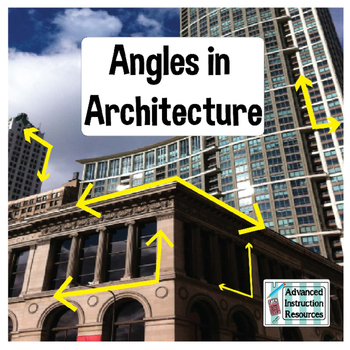
This last week was an introduction to shapes and angles and everything to do with them. We started with a fun activity of the Angle Finder. The angle finder was simply a index card that naturally lent itself to 90 and 180 degree angles. This opened my eyes to see how heavily reliant modern architecture is on 90 degree angles. We also reviews the relationship amongst line and line segments into different categorizations. Parallel lines, if continued indifferently , would not interest. Intersecting, lines on the contrary do intersect. There is even a more highly specific word of perpendicularity which implies a 90 degree intersection. Then, there are skew lines that don't interest and aren't parallel because of where they lay on their corresponding planes.
We also submerged ourselves to the world of shapes and angles. We most dealt with triangles and quadrilaterals since those are the shapes that serve as the building blocks for all others. Triangles can be broken into characterized as acute, right, and obtuse on angles. Further based on their side length, triangles can be considered equilateral( all same size), isosceles(2 same sides) or scalene.The interior angle on a triangle is always 180 degrees. Furthermore, the formula for interior angles besides triangles is S = (n - 2)*180 with n being number of sides. We also exposed ourselves to quadrilateral classifactions. Those, being trapezoids, parallelograms, rhombus, rectangles, and squares. Trapezoids are very irregular in nature but the rest are related to one another in some fashion.

We also submerged ourselves to the world of shapes and angles. We most dealt with triangles and quadrilaterals since those are the shapes that serve as the building blocks for all others. Triangles can be broken into characterized as acute, right, and obtuse on angles. Further based on their side length, triangles can be considered equilateral( all same size), isosceles(2 same sides) or scalene.The interior angle on a triangle is always 180 degrees. Furthermore, the formula for interior angles besides triangles is S = (n - 2)*180 with n being number of sides. We also exposed ourselves to quadrilateral classifactions. Those, being trapezoids, parallelograms, rhombus, rectangles, and squares. Trapezoids are very irregular in nature but the rest are related to one another in some fashion.

Hello,
ReplyDeleteReally neat blog! I like how detailed you are in your posts. One weird thing I have noticed though, is some of your spacing and font size are really weird. It almost looks like you didn't hit space, and somehow some of the font got super small towards the end. I was still able to read and understand it all, so good job!
Hello,
ReplyDeleteI like how you went very in depth with your explanations on angles. As well as to state how much we as people rely on right angles to support buildings around us. I think it was cool to include the different angles that we see in everyday life to really show how often we are around angles. I liked all the information in this post but there were a couple errors that I found in spelling and the random change of font. But, besides that I think it was well written.
-Sam
Hi Kyle,
ReplyDeleteYour blog is amazing! I never knew there were so many different types of lines
in different planes. That is why I clicked on this particular post, because I can clearly
see them on a building not just as windows but intersecting lines, right angles among others. Thank you for sharing your knowledge of the world around us.
Hello Kyle,
ReplyDeleteYou explained the angles very clearly. Also, your example about finding the angles around the room with angle finder is very interesting and it is good for practicing to learn about different types of angles around us. I like your sentence that says, “this opened my eyes to see how heavily reliant modern architecture is on 90-degree angles.” I had never thought about that, but now when I look at buildings, I remember your words and pay more attention to the 90-degree angle used in buildings.